
As sporting data slowly makes its way into rugby league, it can often be difficult to ascertain which statistics actually correlate to on-field success.
We analyse official NRL data to determine which team statistics lead to winning games.
In the modern world of sports, statistics are king. Successful pass-rate, goal-scoring percentage and tackles per game, are just some of the most common phrases you’ll pick up on when watching or discussing most popular sports in 2023. Programs and theories such as xG in soccer (which determines which team should win, based on when and where shots are taken in particular areas of the field etc.) have crept into mainstream television broadcasts in recent years.
Paid fantasy sport games (that determine a player’s in-game value based off a selection of real-life statistics) have developed into billion dollar industries of their own.
In rugby league however, statistical analysis is often not as clear-cut.
There is no credible xG method in rugby league as of yet, that determines a team’s overall performance aside from the official result. This means that individual team statistics such as time in possession, set completion rate and run meters are all widely presented by commentators as markers of team success.
We analyse the last three rounds of NRL (Rounds 9, 10 & 11), to determine which of these aforementioned key statistics are the most relevant to on-field wins.
Time in Possession
Time in possession of the ball is often used as a key indicator of success in any team sport. The claim that if you have more of the ball, you’re more likely to score is the basic (but often relevant) principle behind the use of this statistic.
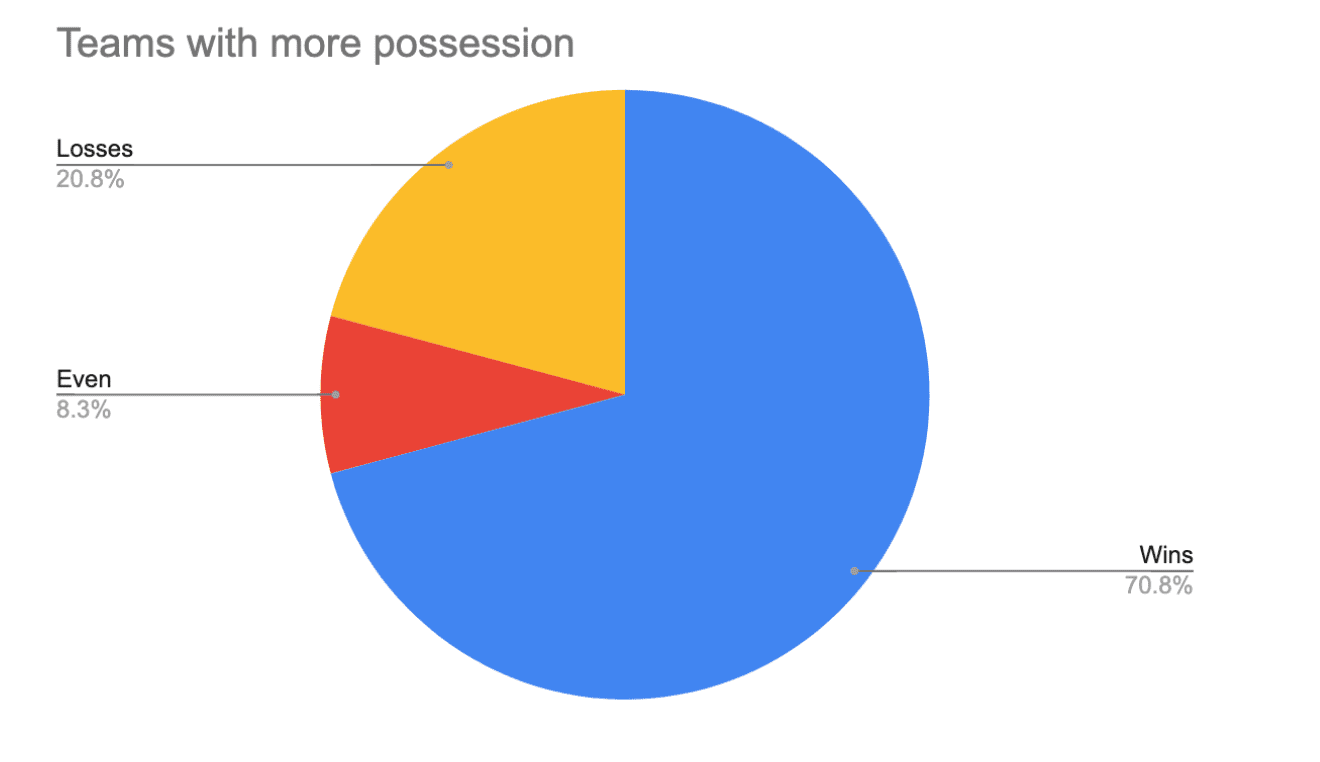
Over the past three rounds of NRL competition, 17 of the 24 games played resulted in the team who held more of the ball coming away with the victory. Two of the games had an even share of possession, and five games resulted in the team with more of the ball losing the fixture.
This equates to a 71 per cent win rate for the team who had more possession.
Set Completion Rate
Set completion measures how many sets of six tackles a particular team completes. A completed set is when a team reaches the last tackle of the set without losing the ball or conceding a penalty (known as an incomplete set). It is often viewed as a measure of how many overall mistakes a team is making over the course of a game.
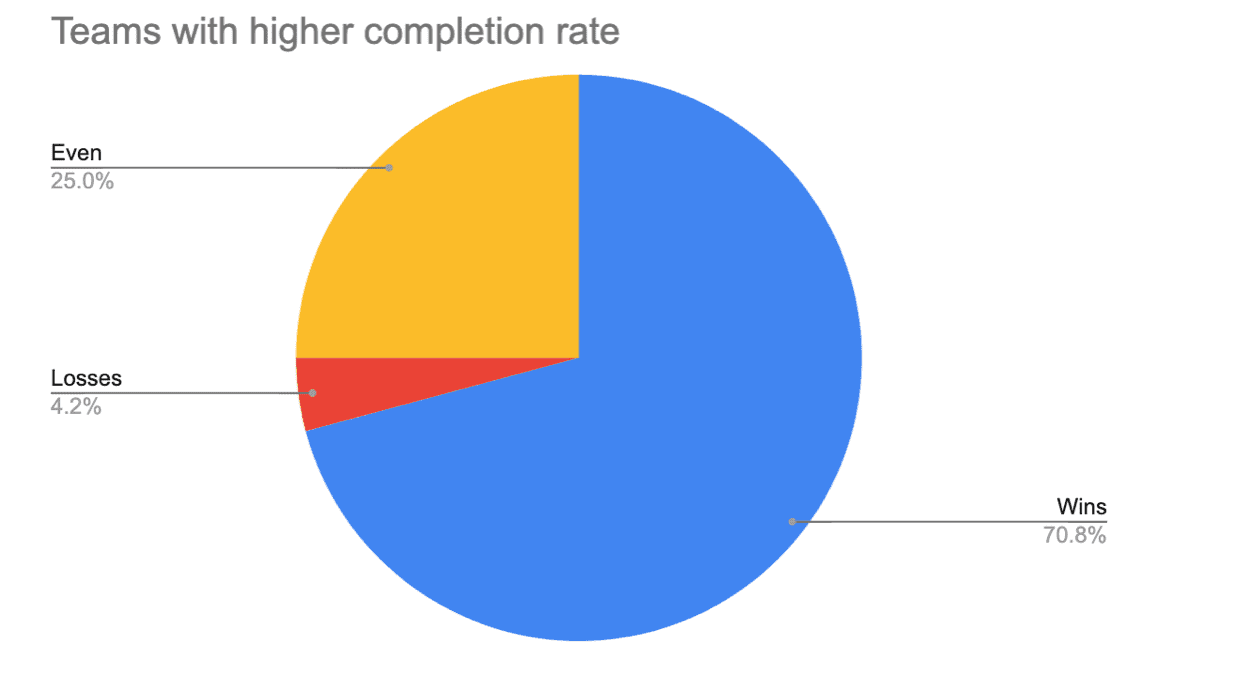
In very similar results to the time in possession statistic, 17 teams that had a higher percentage rate than their opposition were victorious at the game’s conclusion. One game featured both teams completing their sets at the same rate, and six games ended with the team completing at a higher percentage losing.
This equates to a 71 per cent win rate for the team who completed sets at a higher rate.
Run Metres
Run metres simply reveals which team ran for metres during a particular game. While often considered a similar stat to time in possession, the theory is that if you run for more metres (a necessary factor in scoring rugby league points) with that time you spend with the ball, it will go a long way towards winning.
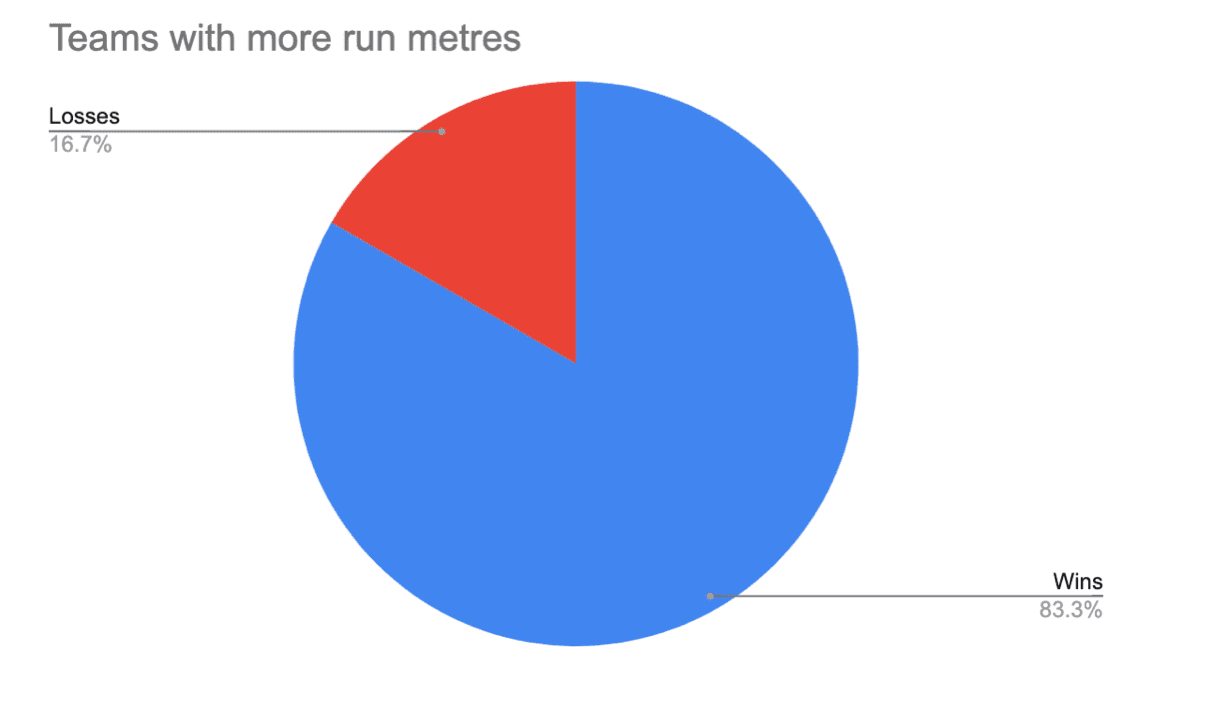
Over the past three rounds of NRL competition, 20 teams that ran more metres than the opposition won the game. Four teams that ran for more metres than the opposition lost.
This equates to an 83 per cent win rate for the team who ran more metres than the opposition.
Ultimately, the most effective of the key statistics appears to be total run metres. While having more time in possession and completing sets at a high rate also goes a long way towards winning games, running for more metres than the opposing team led to an 83 per cent winning percentage.
So, when commentators recount countless figures and statistics to indicate who they think will win any particular NRL match, take a look back at the team’s recent run metre stats and you should be able to get an early insight into who will emerge with the two competition points.
With reporting from Xoese Attipoe.