Australia’s greenhouse gas emissions were down in all major cities amid COVID-19 lockdowns, according to data from the World Air Quality Index project.
At the start of March, all major cities had recorded lower levels of nitrogen dioxide (NO2) and sulphur dioxide (SO2). Levels of carbon monoxide (CO), which is a by-product of motor vehicle use, decreased nationally an average of 23 per cent between January and March.
According to CSIRO principal research scientist Dr David Etheridge, CO is a strong indicator of fossil fuel use and its levels fluctuate in response to usage.
“Carbon monoxide is a key indicator of burning fuels for energy. That can be aeroplanes, cars, power stations, wood-heaters,” Dr Etheridge said.
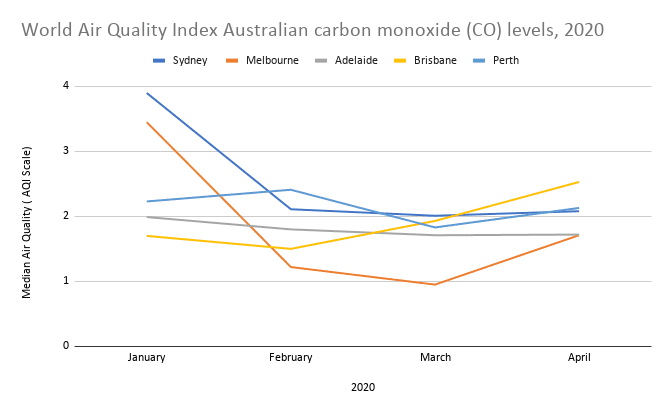 Data source: World Air Quality Index
During the first quarter of 2020, SO2 also saw a nation-wide decrease – an average of 22 per cent. As a by-product of the burning of fossil fuels, SO2 is also a strong indicator of our reduced energy demands during coronavirus restrictions.
 Data source: World Air Quality Index
NO2 levels have also decreased as a result of reduced road traffic and the combustion of fossil fuels. Data from NASA confirms March levels of NO2 decreased by as much as 50 per cent compared to the 2015-2019 national baseline, with the image below showing a decrease in hotspots compared to the March average.
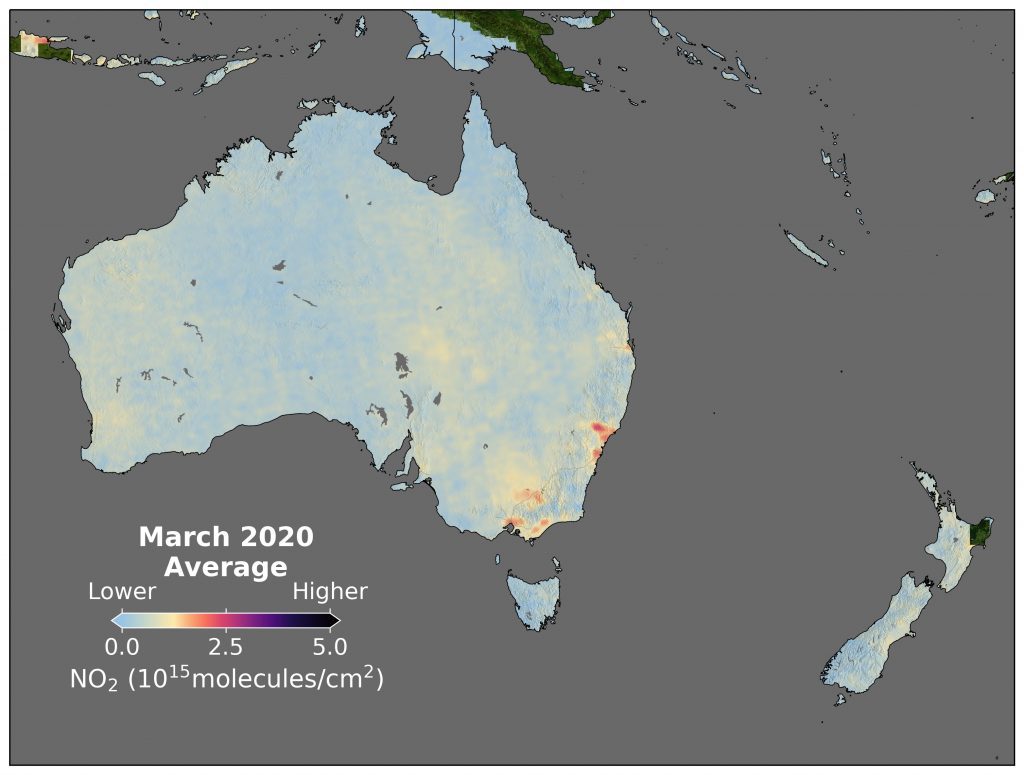

Images: NASA
The timeline below tracks decreases in NO2 levels relative to Australia’s lockdown measures using additional data from NASA’s National Aeronautics and Space Administration.
Data source: NASA
Illawarra Greens Councillor Cath Blakey said Australians took more value in their public spaces and ability to work from home in the lockdown period and that this contributed to emissions decreases.
“There was a lot less traffic because people were confined to their homes. People that still had jobs were working from home and people were taking walks,” she said.
And as well as these gases, the chart below shows the estimated nation-wide decrease of carbon dioxide (CO2) levels with data from a recent study in Nature Climate Change.
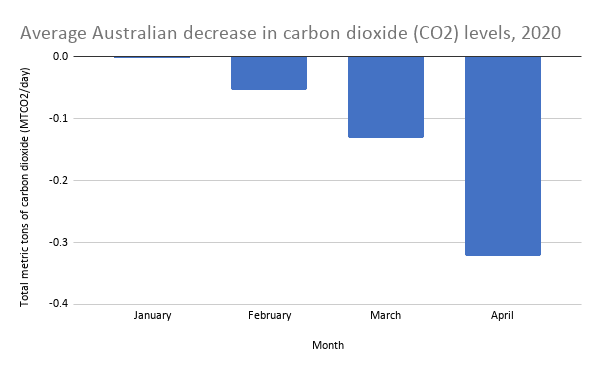 Data source: Nature
The figure shows that the global effects of lockdowns resulted in a daily decrease in CO2 emissions by 17 per cent by April 2020, relative to the mean level in 2019. However, it is important to note that the data is not in real-time as CO2 is difficult to measure in the short term.
“Because it’s a long-lived gas the signal will take some time to manifest in the atmosphere,” Dr Etheridge said.
The shorter-lived gases such as CO and NO2 give the most accurate depiction to our decreasing emissions since COVID-19, he said.
“You can see the immediate response in the atmosphere especially in those short-lived gases, and there will be a change in CO2 in the atmosphere as we know there has been a change in emissions.”
These figures also predict that daily CO2 emissions in early April 2020 are comparable to their levels in 2006. This data shows a change in our current atmosphere and, as Dr Etheridge explained, puts into perspective the rate of increase in greenhouse gas emissions observed over the past 14 years.
“It’s making us think about what we’ve done over the last decades,” he said.
The paper said the current 17 per cent decrease in CO2 is the rate of decrease needed year-on-year over the next decades to limit climate change to a 1.5-degree Celsius warming.
Cr Blakey said there is a real possibility Australia won’t be meeting the Paris Agreement target of 1.5-degree warming. She said this current rate of emissions decrease should be a catalyst for future climate policy decisions if Australia wants to meet these targets.
“The pandemic definitely tells us that it’s possible to decrease emissions when there’s political will. It’s unfortunate in this case though it’s required a pandemic to do it.”
She said there are opportunities to be made in climate investments post-pandemic to keep a reduction in greenhouse gas emissions, such as increased bike paths as seen in Milan and Paris.
“People may not have to fly, we’ve realised we can do it by conference. Those sorts of behavioural changes might come in.”
By not returning to the previous behaviour, it may not lead to a return to previous emissions, she said.
“Our behaviour dictates emissions, how much we travel, how much we make things and what sort of energy we use and what sort of processes we use to do that.”
Cr Blakey also said there are opportunities for Australia to pull its weight.
“The economics of renewables are cheaper than buying coal-fired power stations.
“There’s also lots of benefits in becoming environmentally friendly, including improving houses so it doesn’t use as much energy.”
Dr Etheridge said that, in the meantime, we are interrupting our national emissions increase and we may not go back to prior levels, and if society and industry respond to current levels Australia’s future emissions could decrease.
“I think that would be a good thing for the atmosphere. It might be a good thing for people, we might decide that we can be more productive, more healthy, more efficient and less polluting by thinking about what we’ve done over the last decade.”